An extensive body of research has shown that out-of-school time programs help:
- Excite children about learning
- Teach important workforce skills
- Provide nutritious meals and opportunities to be physically active
- Reduce the likelihood that youth will engage in risky behaviors
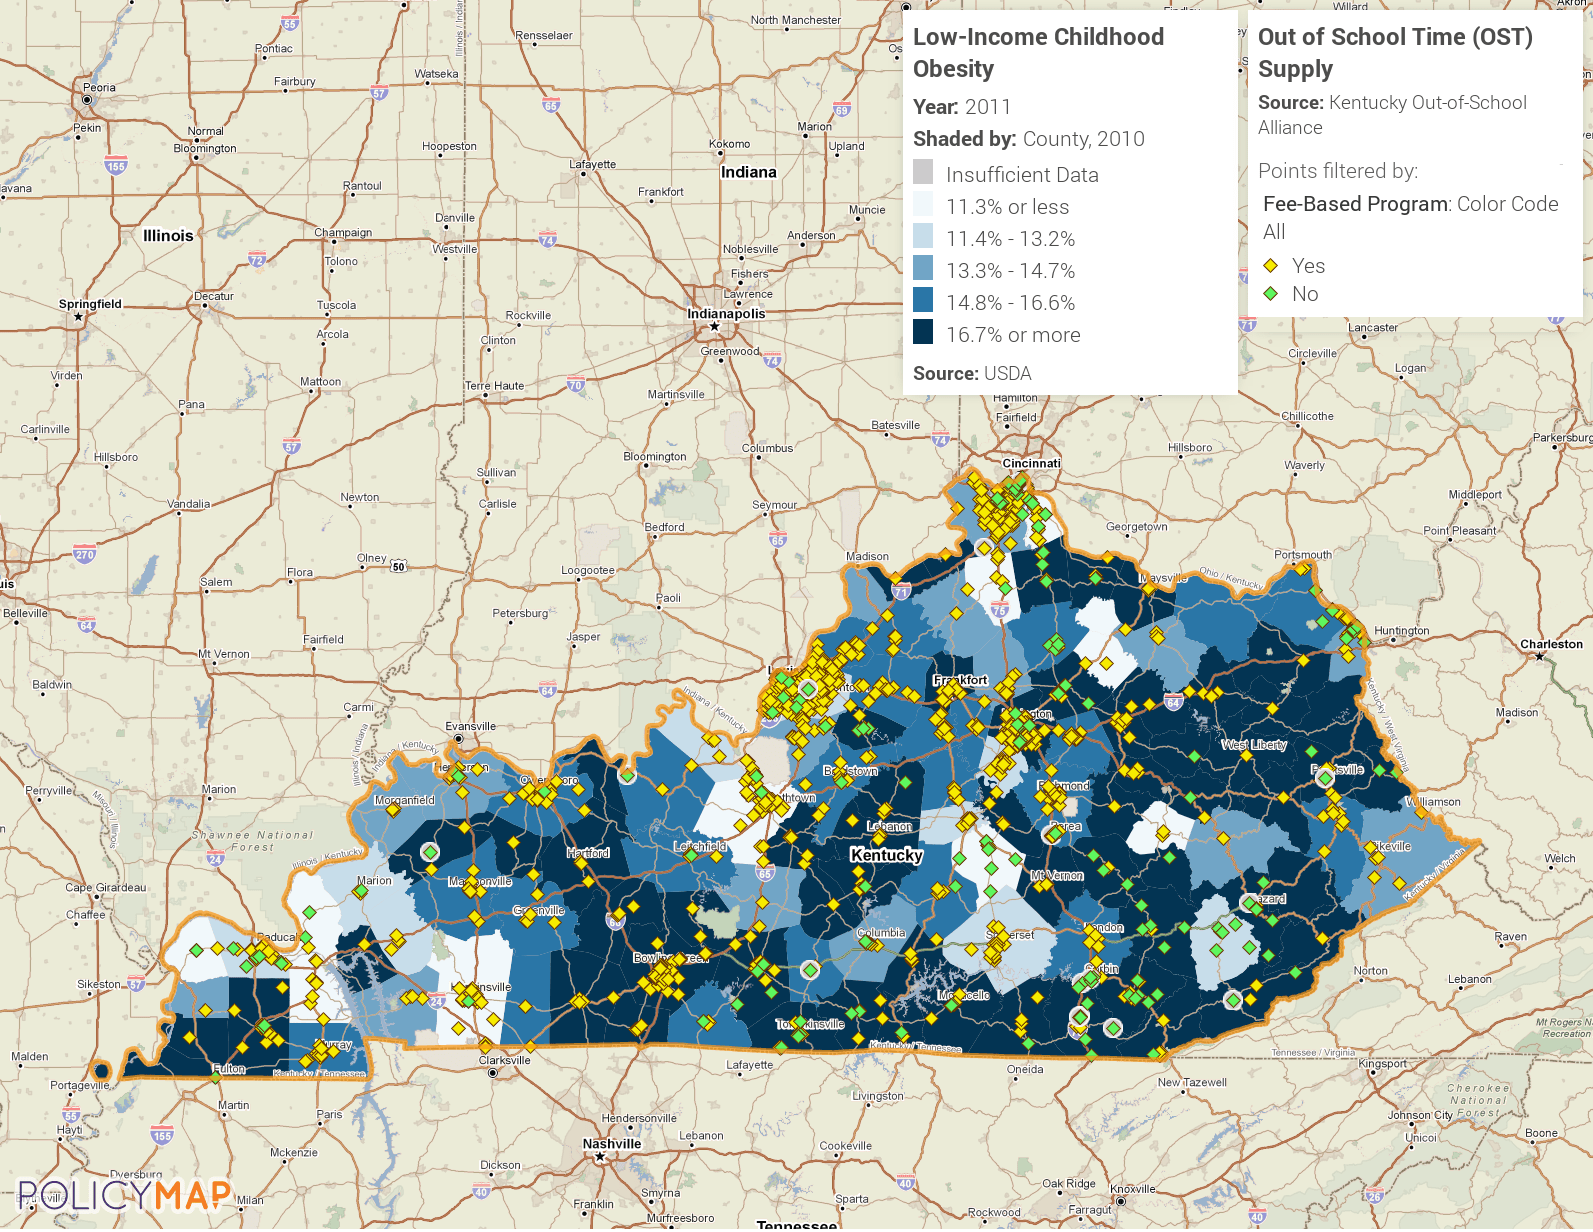
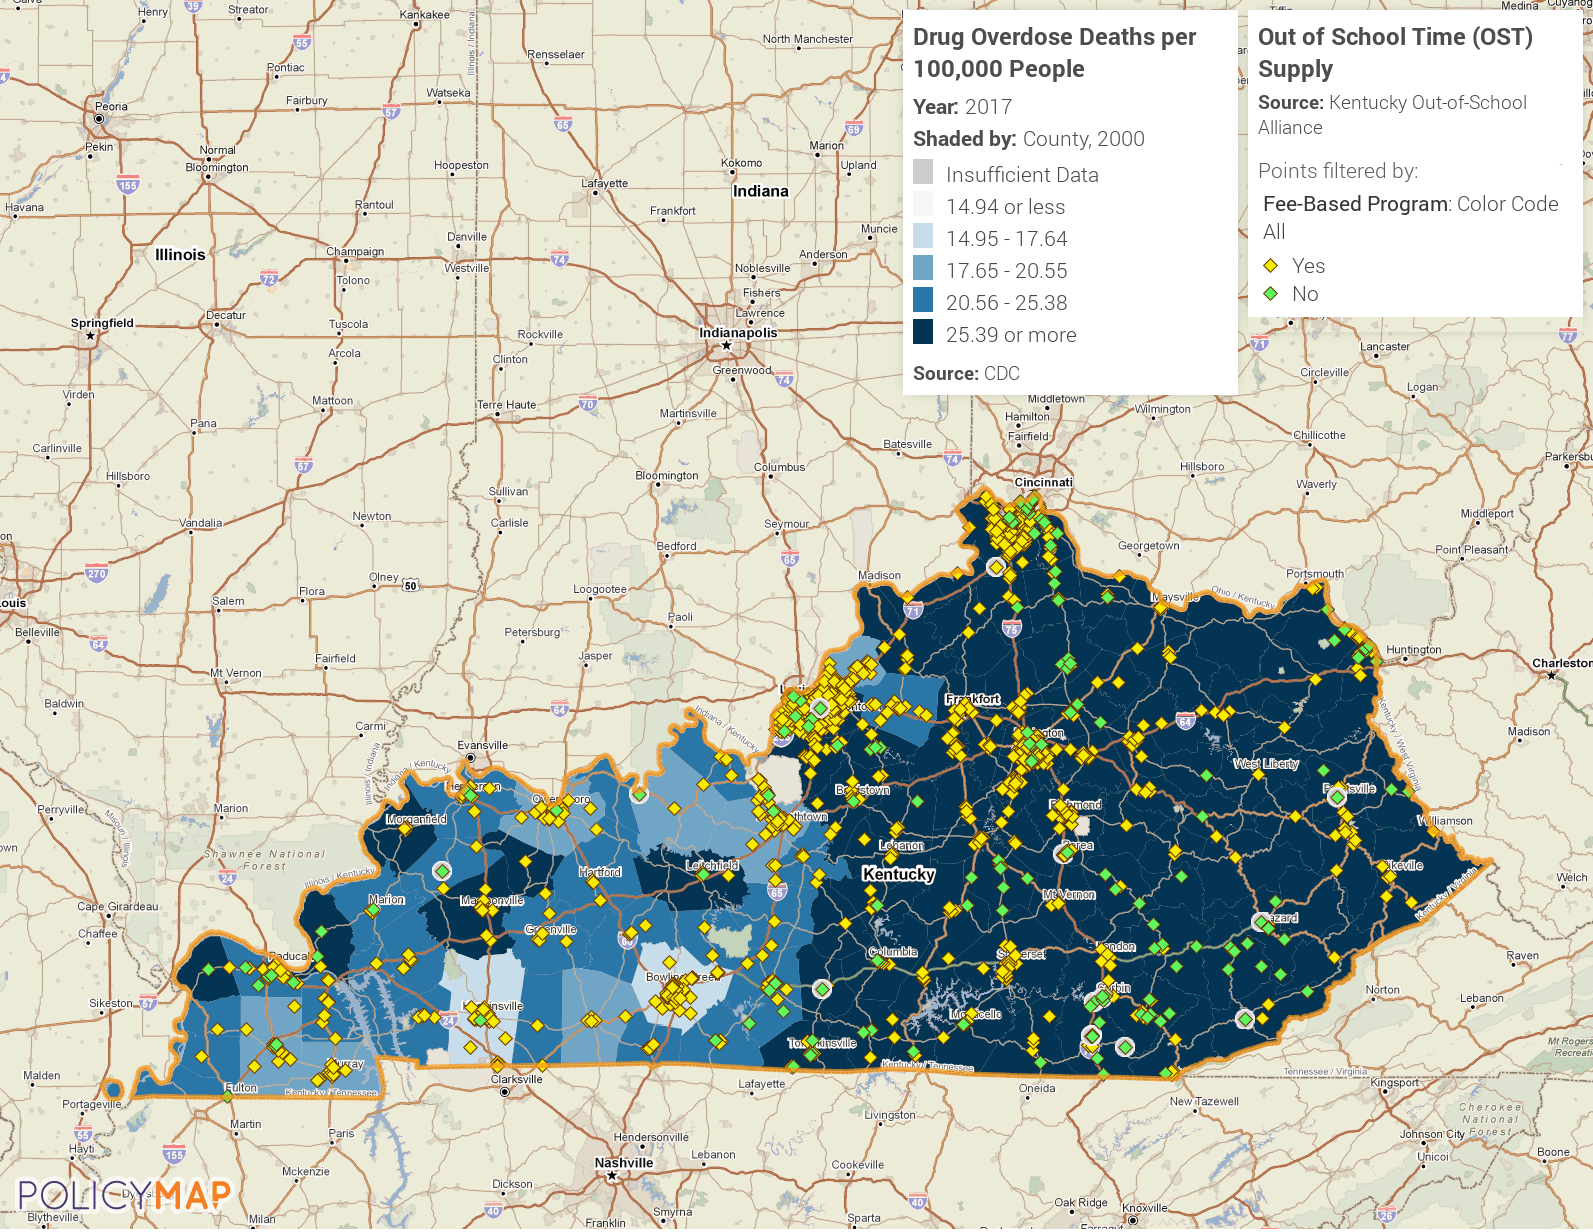
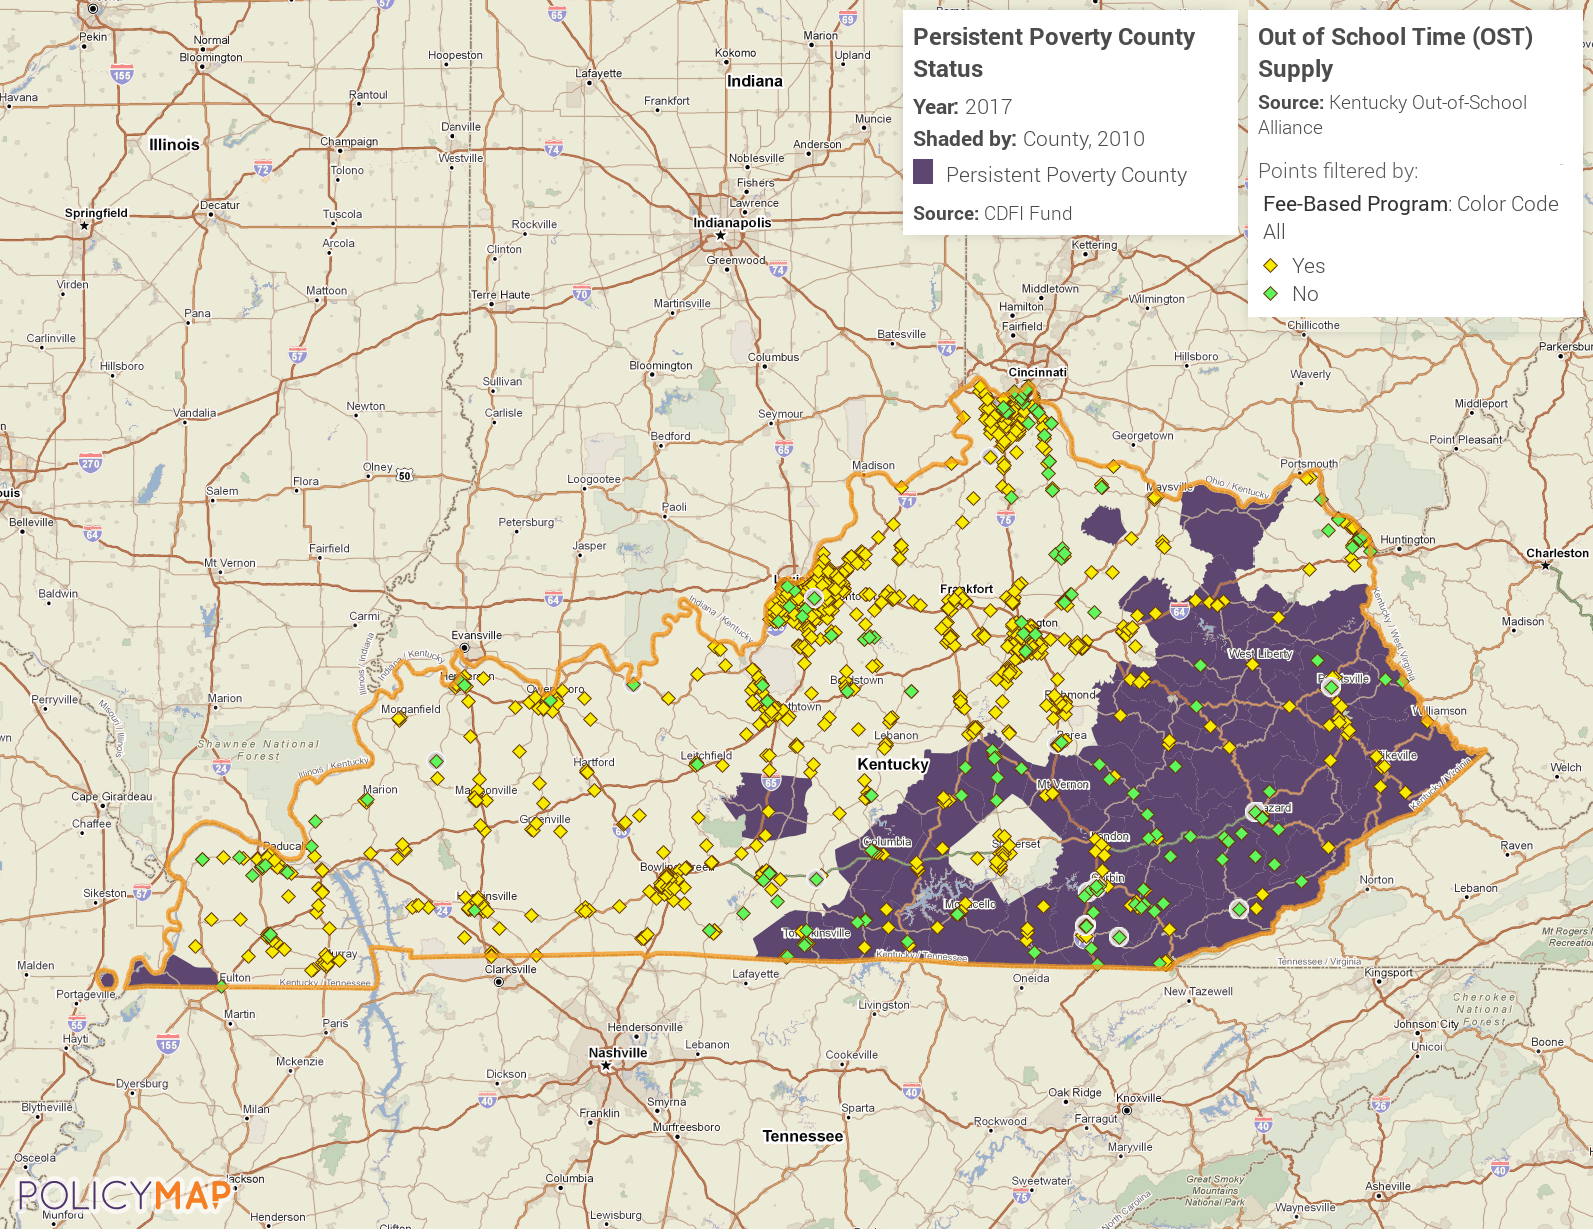
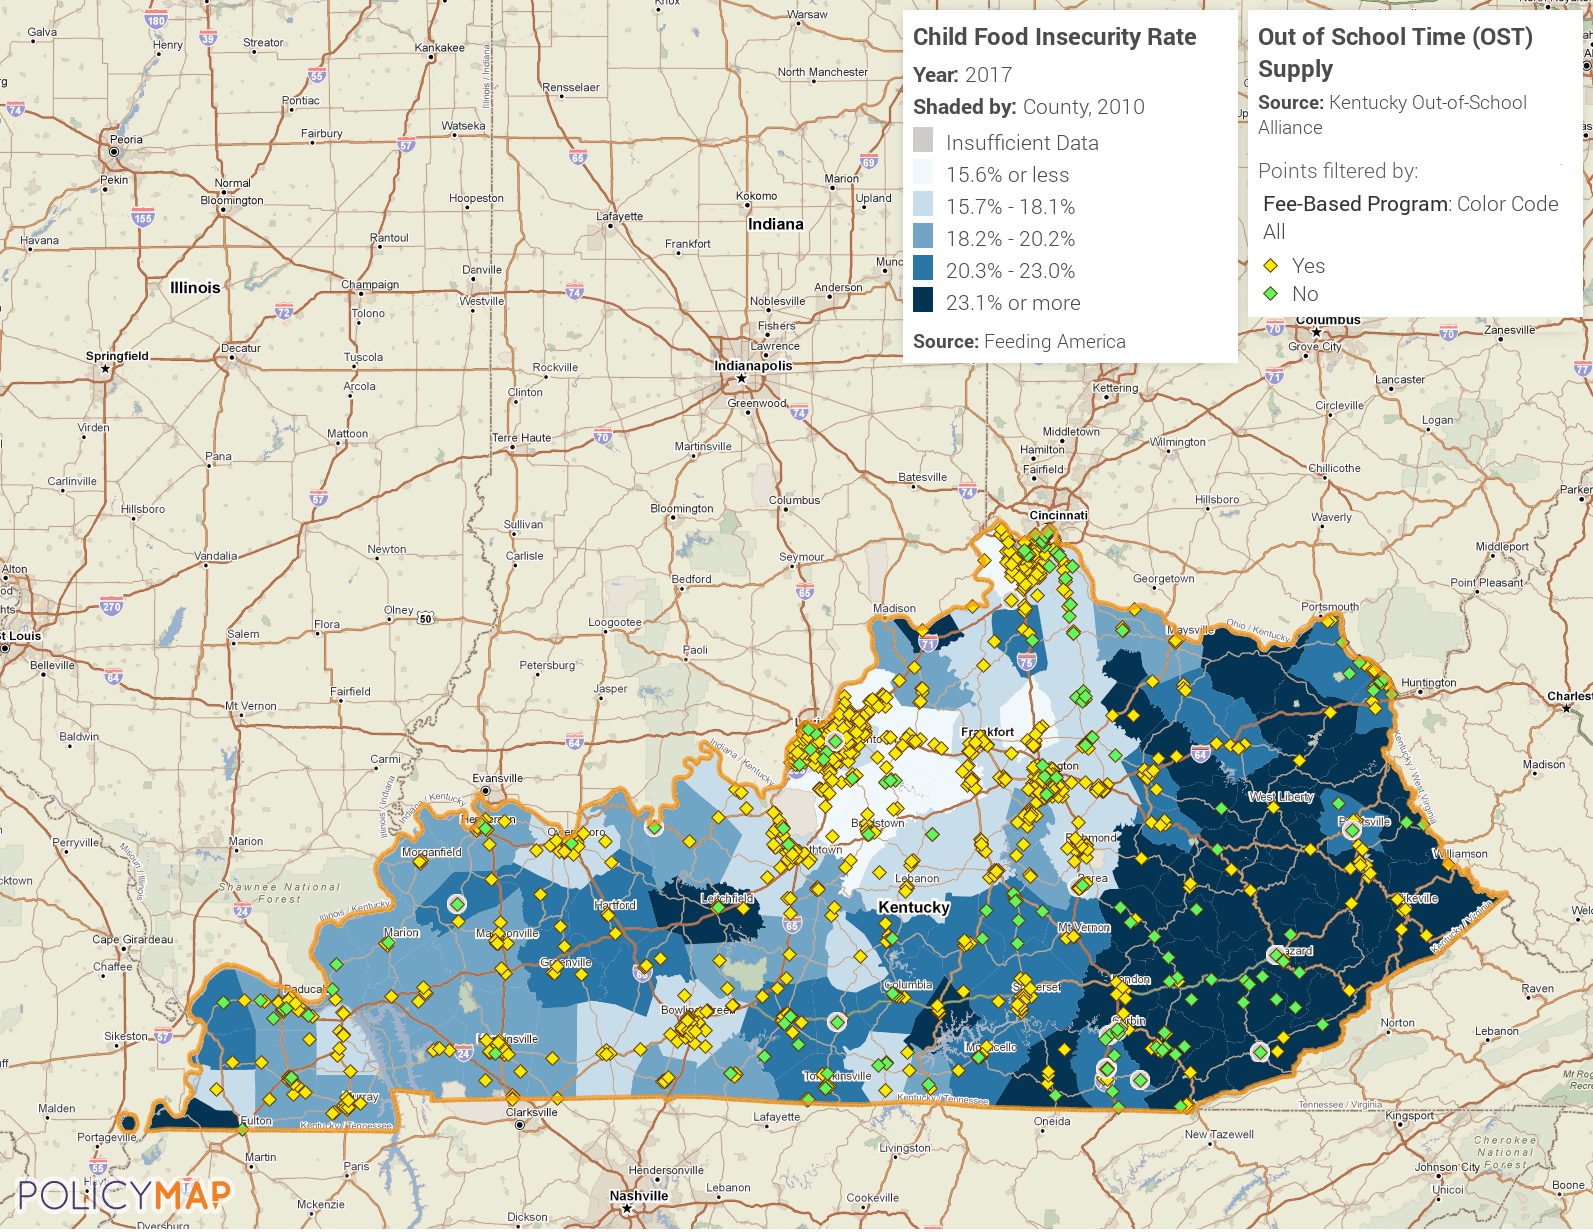
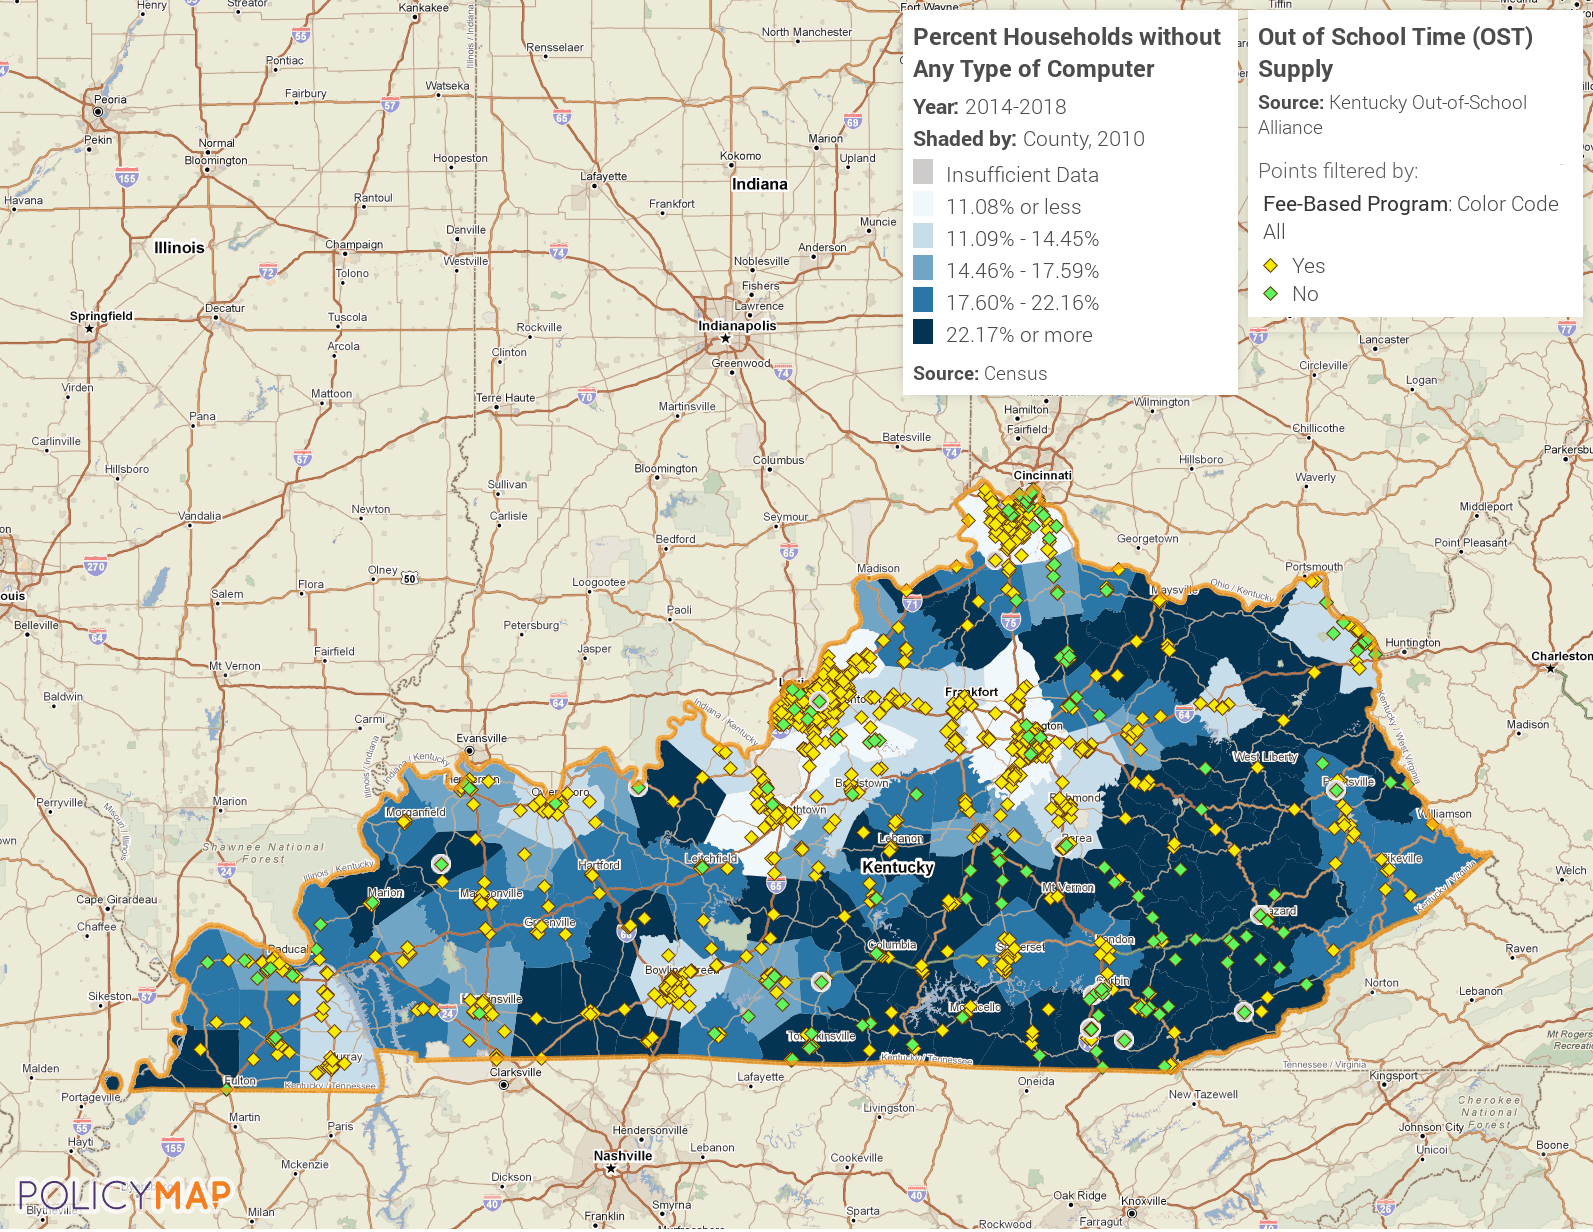
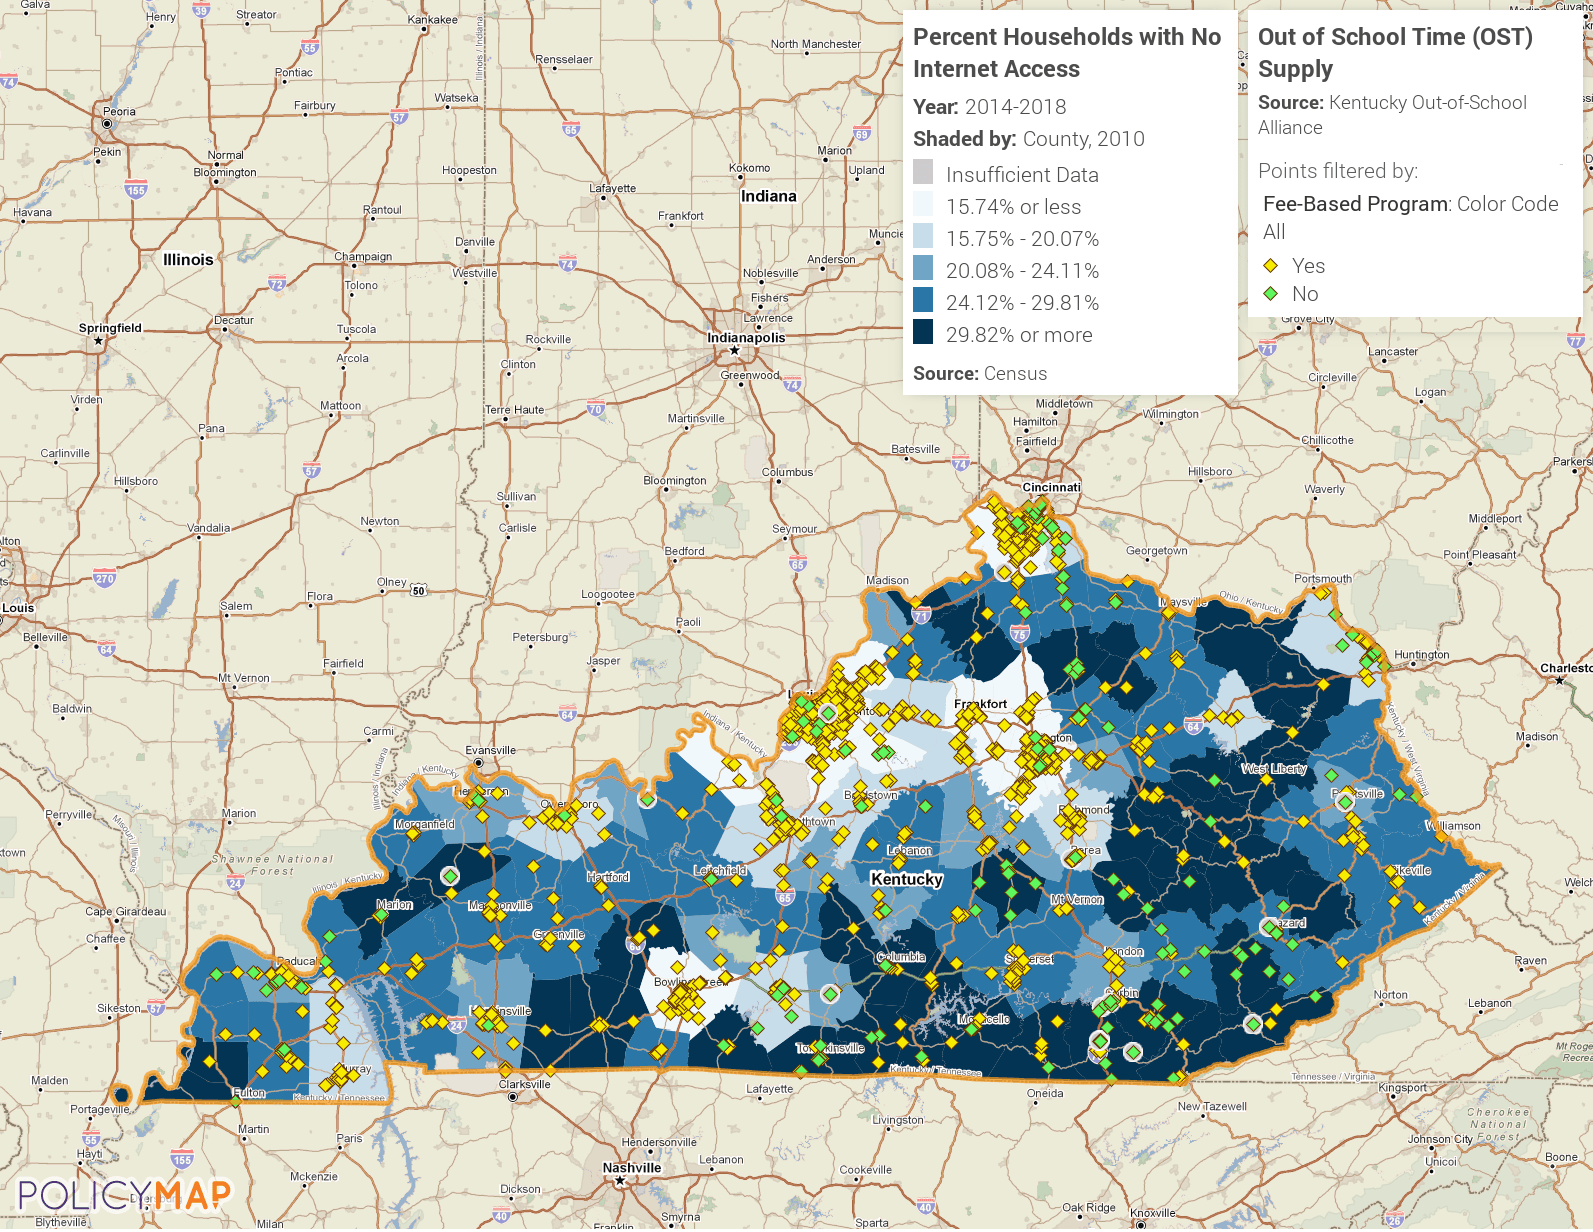
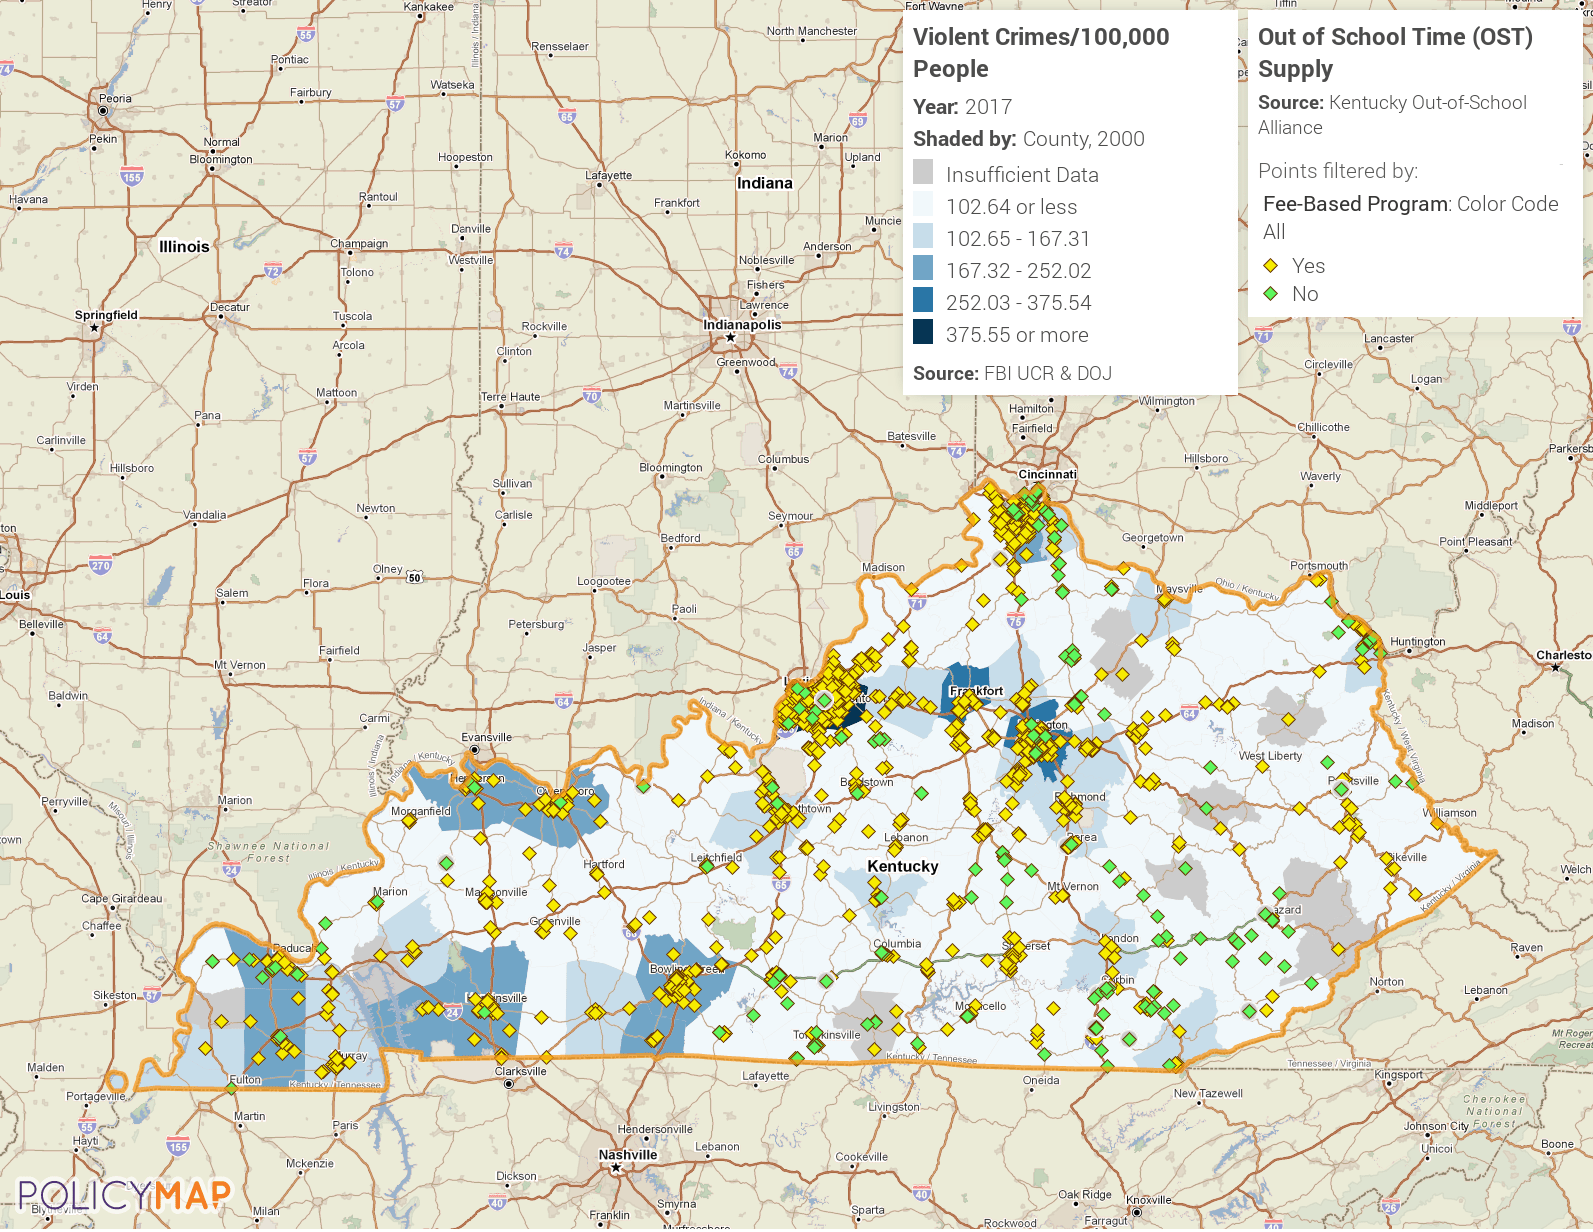
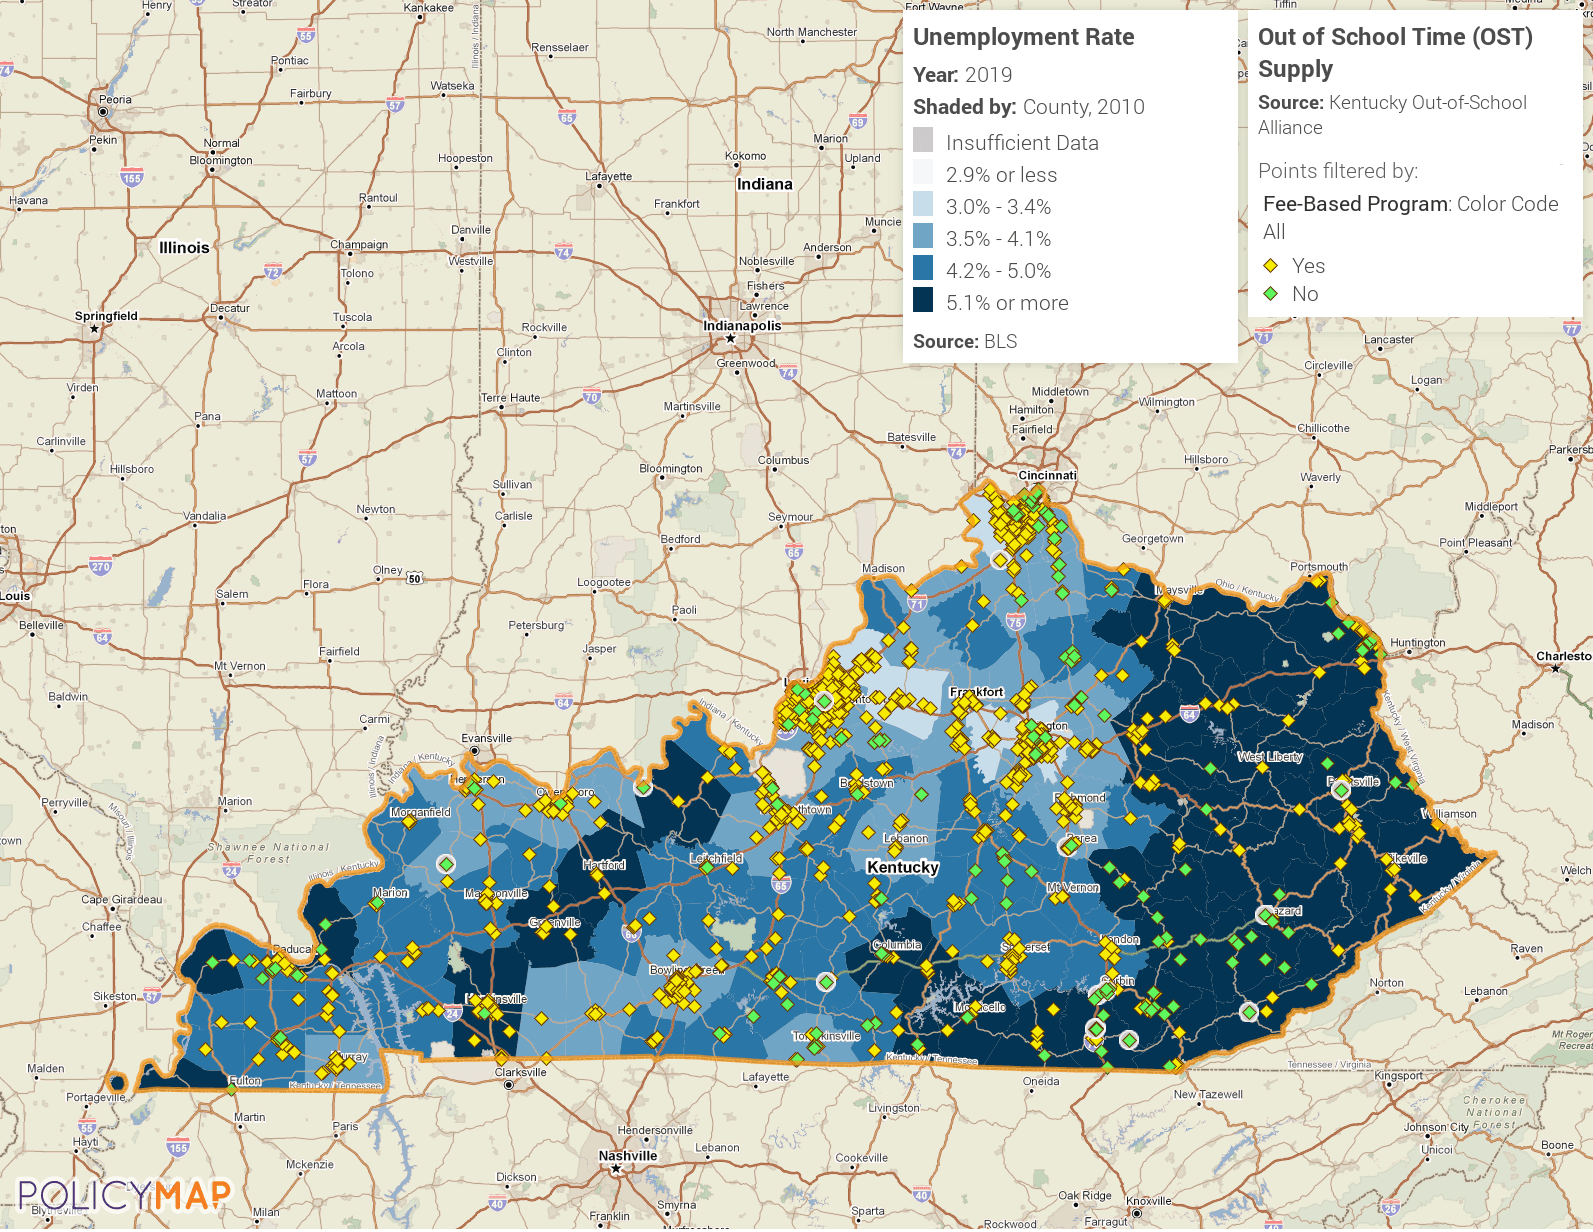
Click on the maps below to see how your community’s current OST landscape relates to a number of key indicators along the following categories: incomes and spending, quality of life, economy, education, housing, and health.
Feel free to download and share these maps with local leaders in your community to make the case for how improving access to out-of-school time is good not only for kids, but for communities overall.
Incomes & Spending

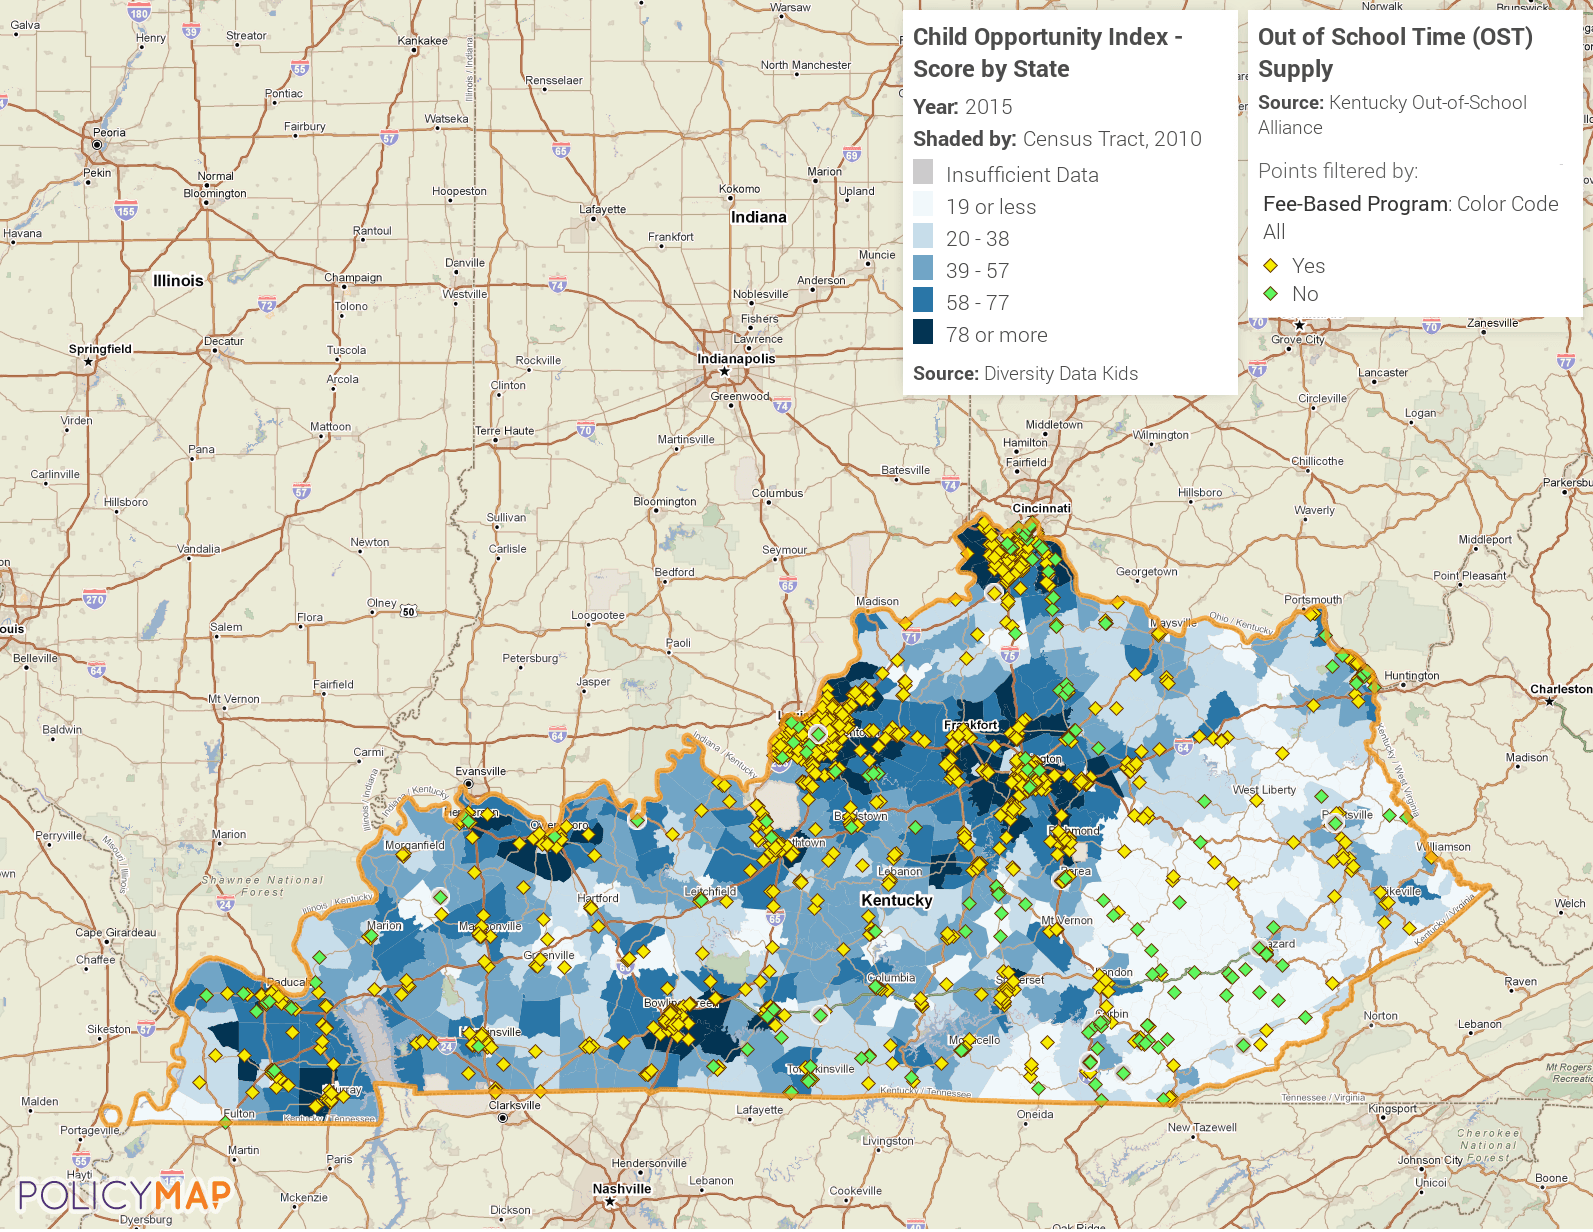
Quality of Life
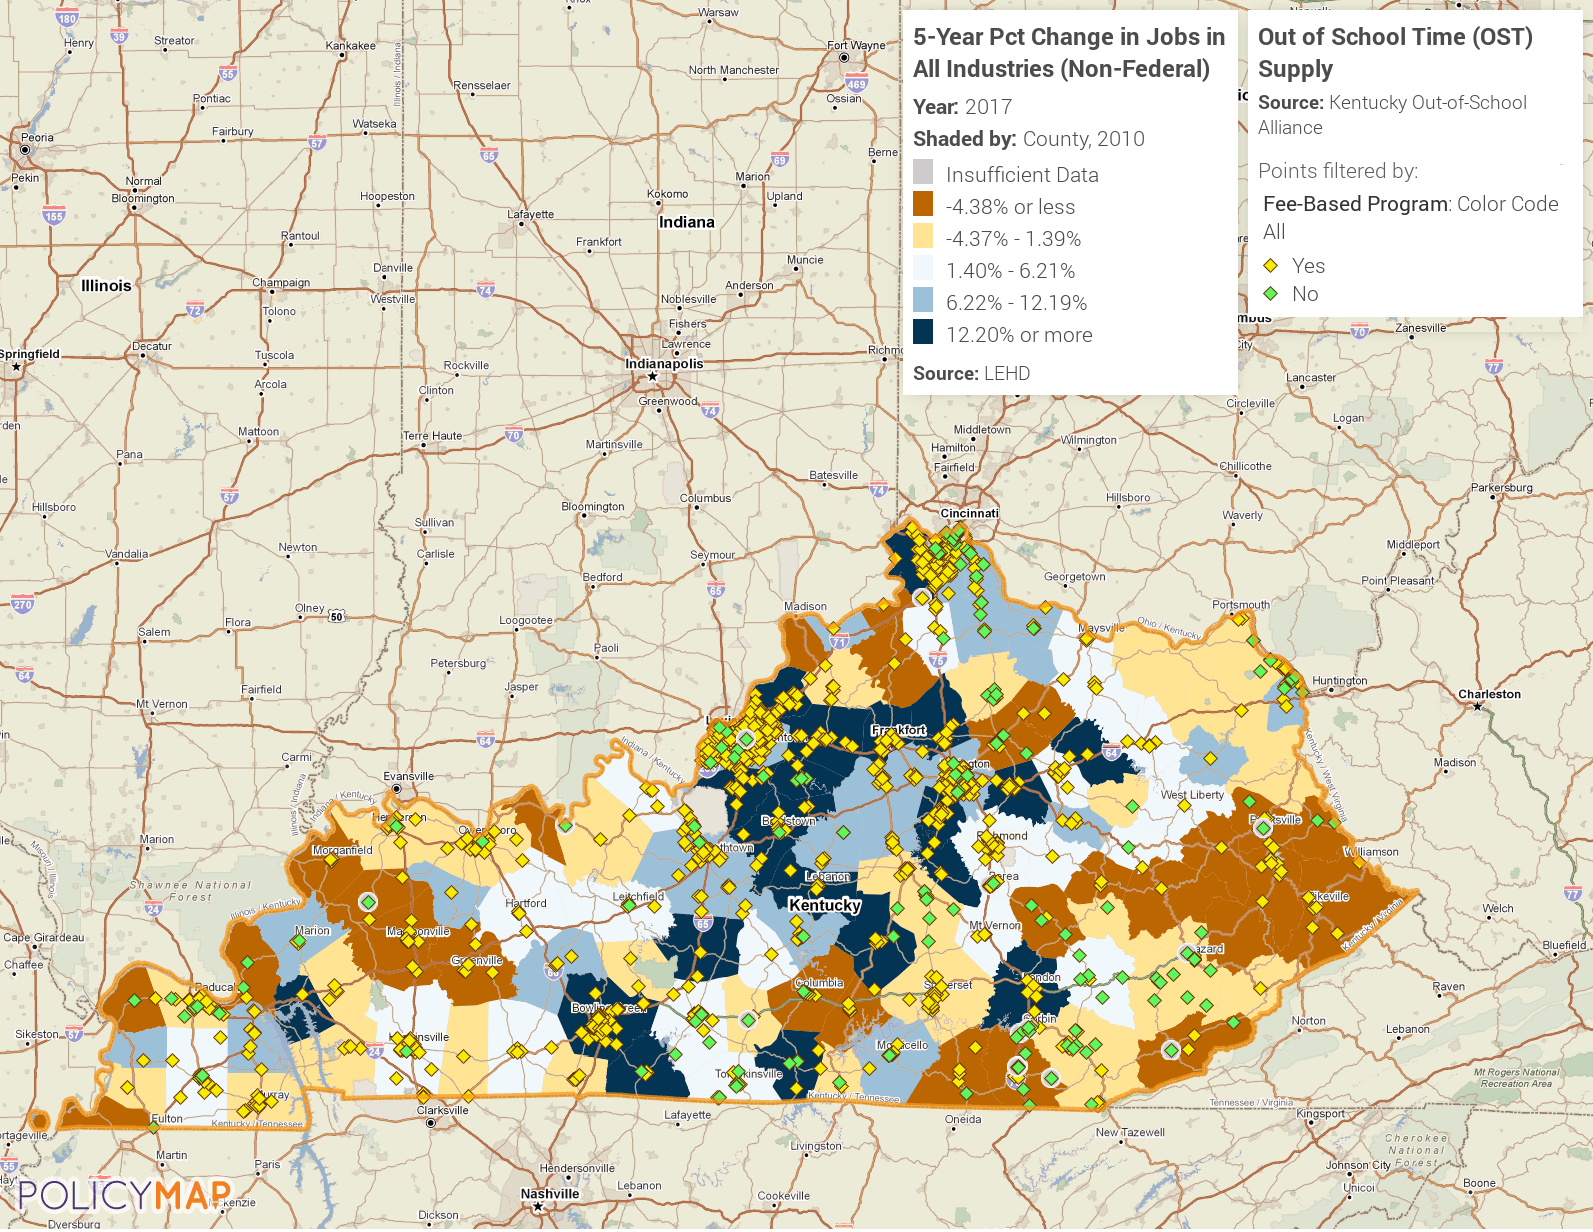
Economy
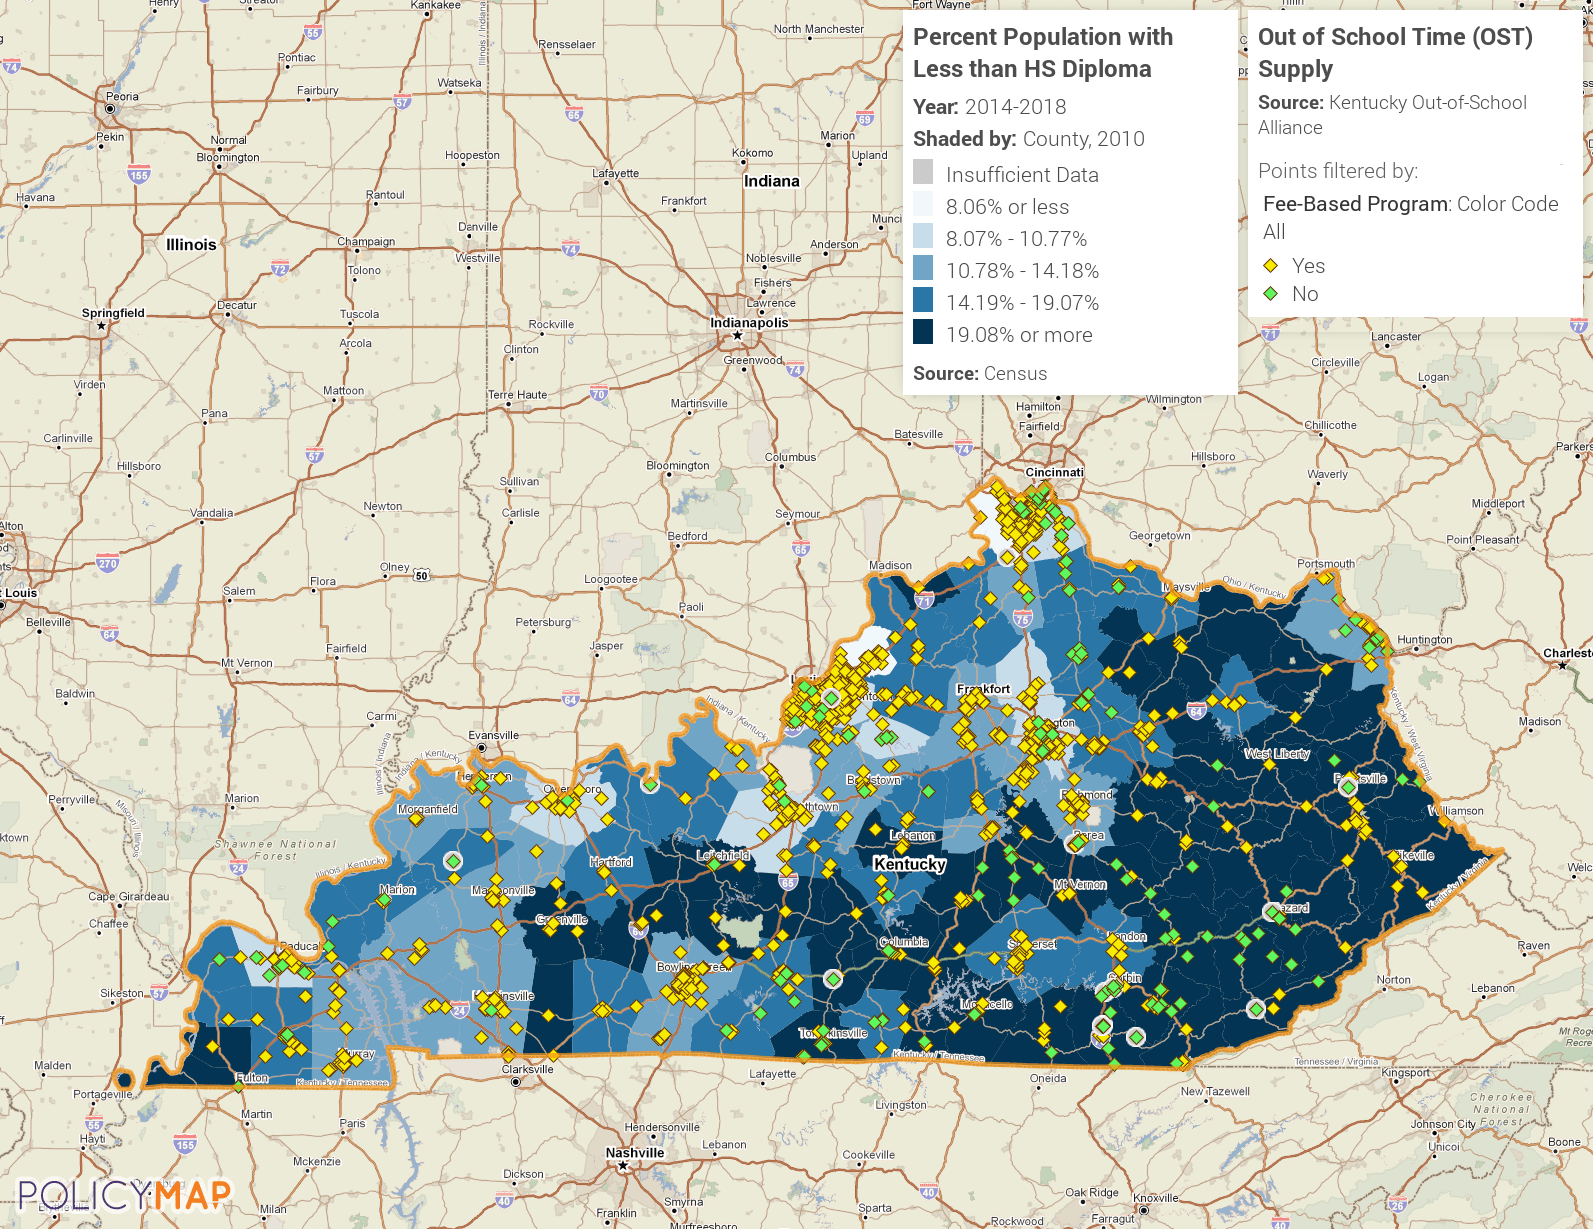
Education
Housing
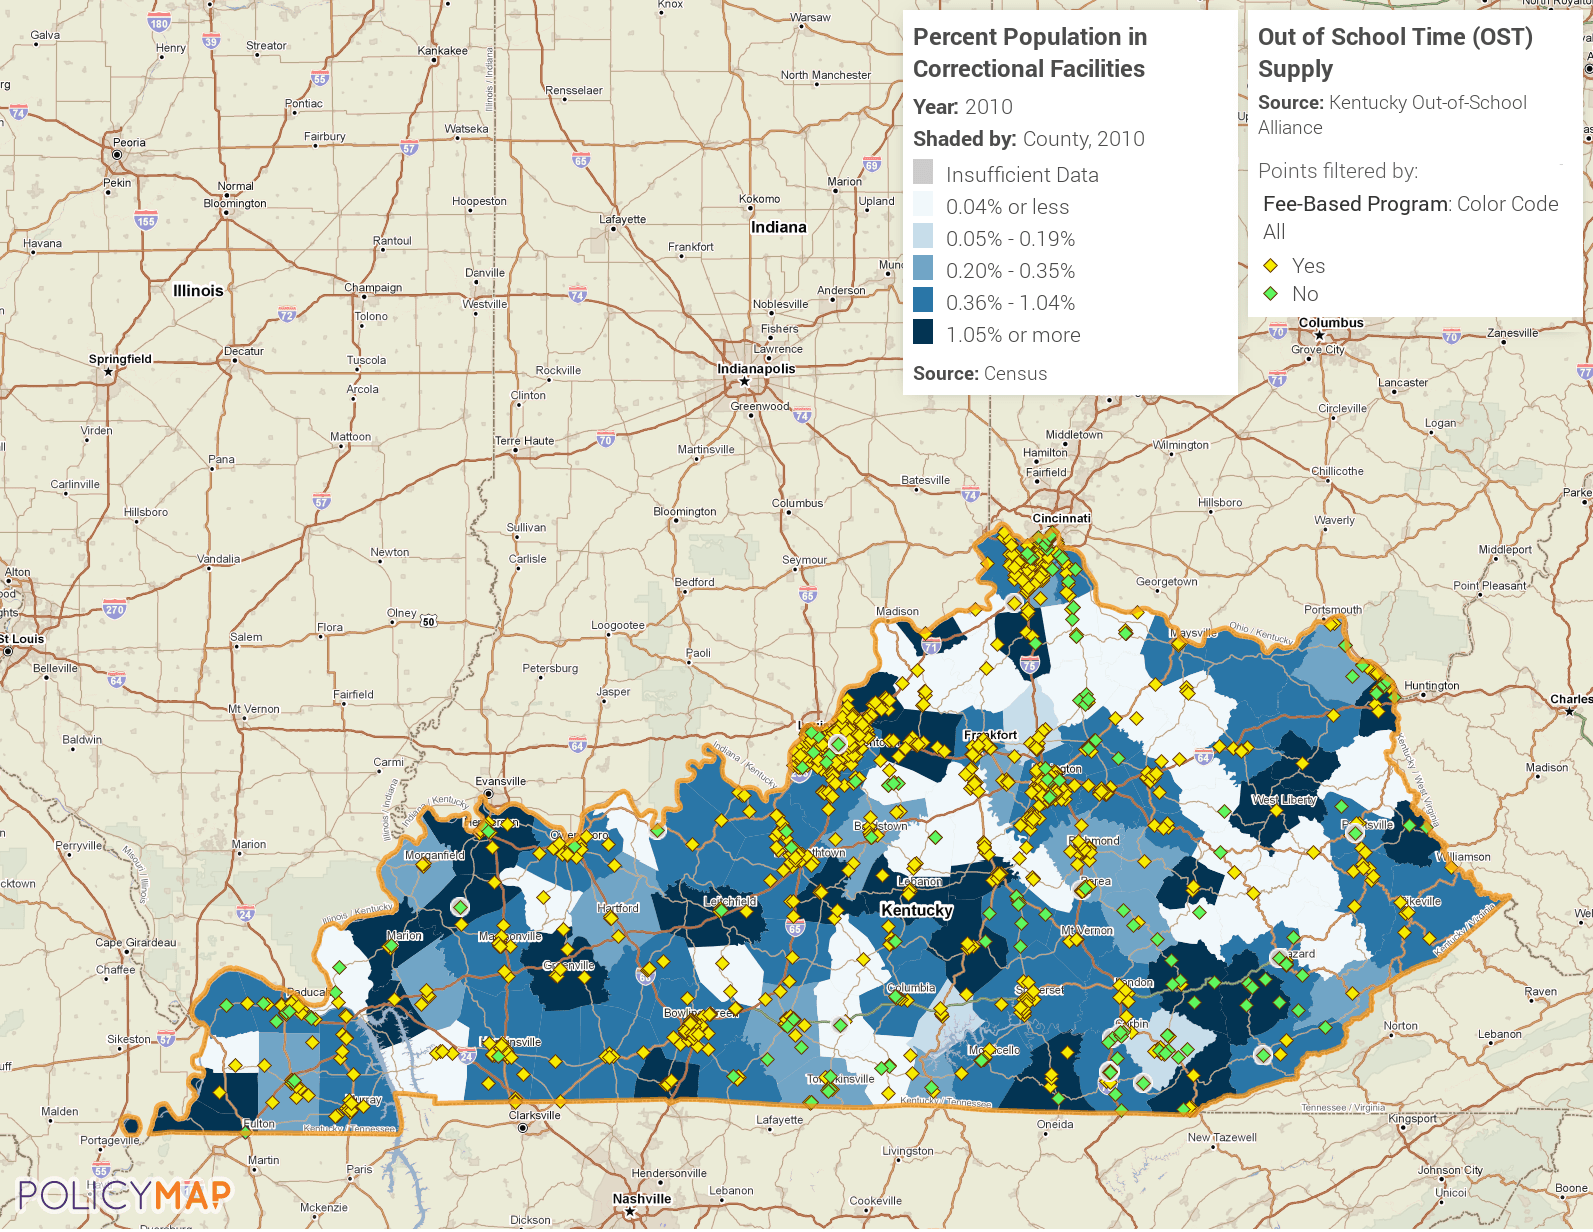
Health